Calculating Exposure
This section explains how to calculate exposure in the RiskChanges platform, based on the hazard and element-at-risk (EaR) data previously uploaded. Users can choose to compute exposure either for individual features or aggregated by administrative boundaries.
Overview
Calculation identifies which elements are affected by a hazard based on spatial overlap. The output includes both spatial layers and attribute tables with key indicators.
There are two modes of calculation:
Individual: calculates at the feature level (e.g., per building or road segment).
Aggregated: calculates exposure based on administrative units (e.g., parish level).
Note: The aggregated calculation requires a calculated individual exposure layer to be available.
Instructions
Open the Exposure Module
Go to the Project Page.
Click on the Exposure tab ni the sidebar.
Click Add Exposure to begin.
Select Calculation Type
You will see two tabs: - Individual: for feature-level exposure results. - Aggregated: for summarized results by administrative boundaries.
Fill in General Information
In the General section, enter the following: - Layer Name: name for the exposure result layer. - Hazard Layer: select a previously uploaded hazard dataset. - Elements-at-Risk Layer: select the EaR dataset to be assessed. - Intensity type: choose from: Minimum, Average, or Maximum.
Note: This setting controls the map visualization after the calculation. All intensity types will still be calculated in the background and can be switched later.
Run the Calculation
Click Save to start the exposure calculation.
Once completed, the platform will display the result on the map.
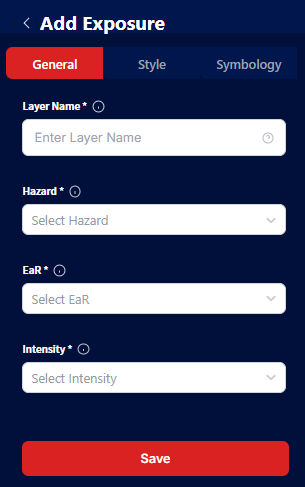
Calculate exposure settings
Results and Output
The exposure calculation produces:
A spatial map layer showing the exposed features or areas.
A table dispplaying detailed exposure statistics, including:
Minimum, average, and maximum hazard intensity affecting each feature.
Exposed area, length, or fraction.
Users can inspect and download this data or use it in further modules.

Exposure calculation result in a table
There is also a feature summary table that provides an overview of the exposure results. This feature provides both table and chart views for better understanding.

Exposure calculation result summary

Exposure calculation summary in a chart
Map Visualization
Once exposure is calculated, the results appear on the Map Panel on the right side of the screen.
Map tools include:
Zoom In / Zoom Out
Reset to North
Reset Map View
Full-screen Mode
Center on Current Location
Layer Options (for switching basemaps: OpenStreetMap or Satellite)
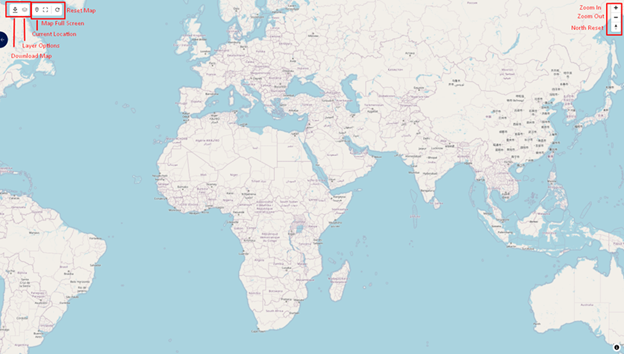
Map display in RiskChanges
Legend and Layer Settings:
When a layer is selected, users can: - Reorder layers (drag and drop) - Zoom to layer - Adjust opacity - Toggle visibility - Show / hide legend - Remove layer
Users can also click on features on the map to view attribute data such as exposure levels, number of floors, or intensity values.

Focusing on one feature to see the result details
Filter and Style the Results
Users can choose which intensity type (min/avg/max) to show on the map.
Style and symbology xan be adjusted to better visualize the data.
Specific classes or ranges can be selected for focused viewing. The map will filter accordingly.
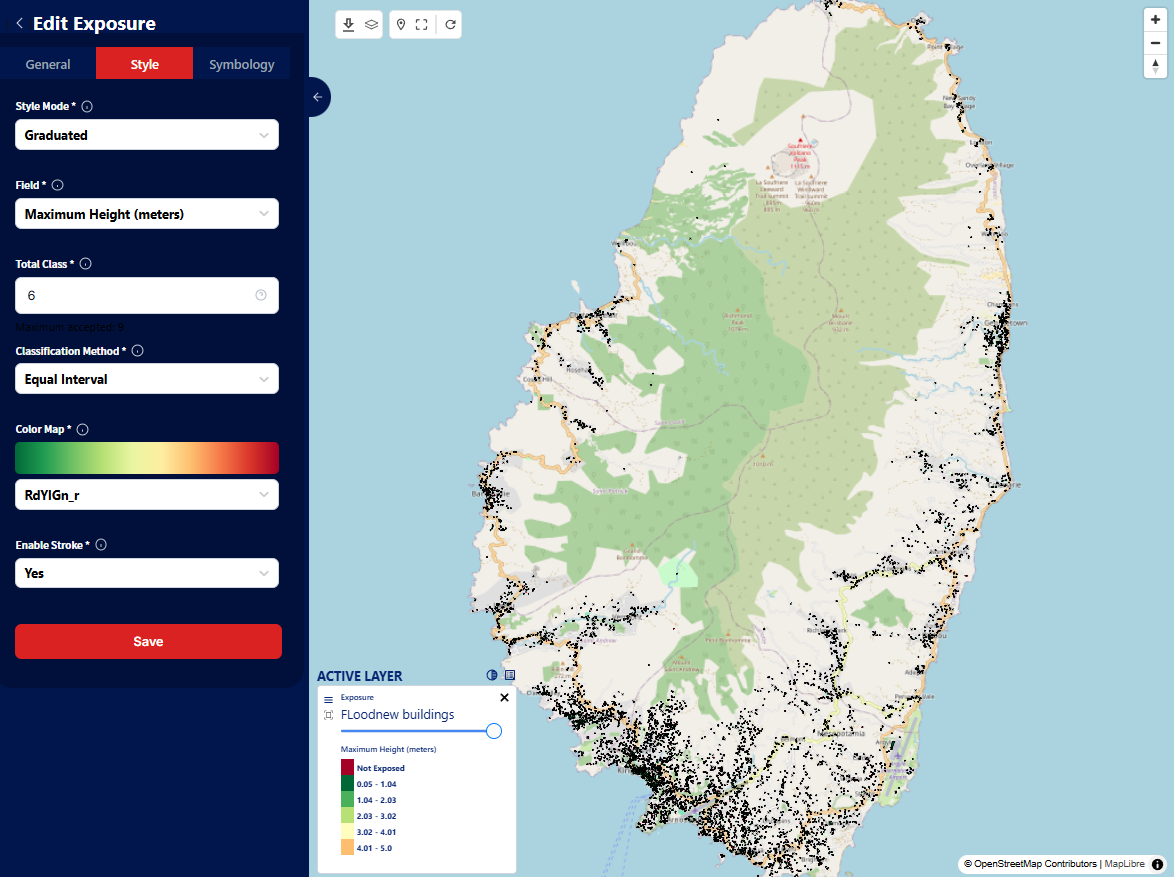
Exposure result map visualization
Download the Map
The Download button allows users to export a map layout:
Default Setting: a pre-formatted layout is downloaded automatically.
Custom Setting: users can define:
Page Type or Resolution
Orientation (portrait or landscape)
Output format (e.g., PNG, PDF)
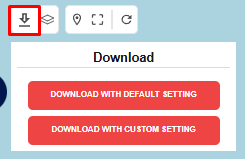
Download map feature