Loss Calculation and Scenario Module
This section explains how to calculate Loss using previously calculated exposure data, and how to create and apply different Scenarios (e.g., future hazard models or urban development changes) in RiskChanges.
Before proceeding, ensure that all necessary data (Hazard, Elements-at-Risk, Vulnerability) has already been uploaded, and Exposure layers have been calculated. Please refer to the Input Data and Exposure section if needed.
Calculate Loss
The Loss module computes the economic or physical losses resulting from hazard exposure and vulnerability. Loss is calculated as a function of:
Hazard intensity (from the Exposure layer)
Vulnerability curve
Value of the exposed elements
Loss calculation settings
Steps to Calculate Loss:
Open the Loss Module
Go to the Project Page.
Click on the Loss tab in the sidebar.
Click Add Loss.
Choose Calculation Type
As in the Exposure module, you can choose: - Individual: Calculate loss per feature. - Aggregated: Calculate loss based on administrative units.
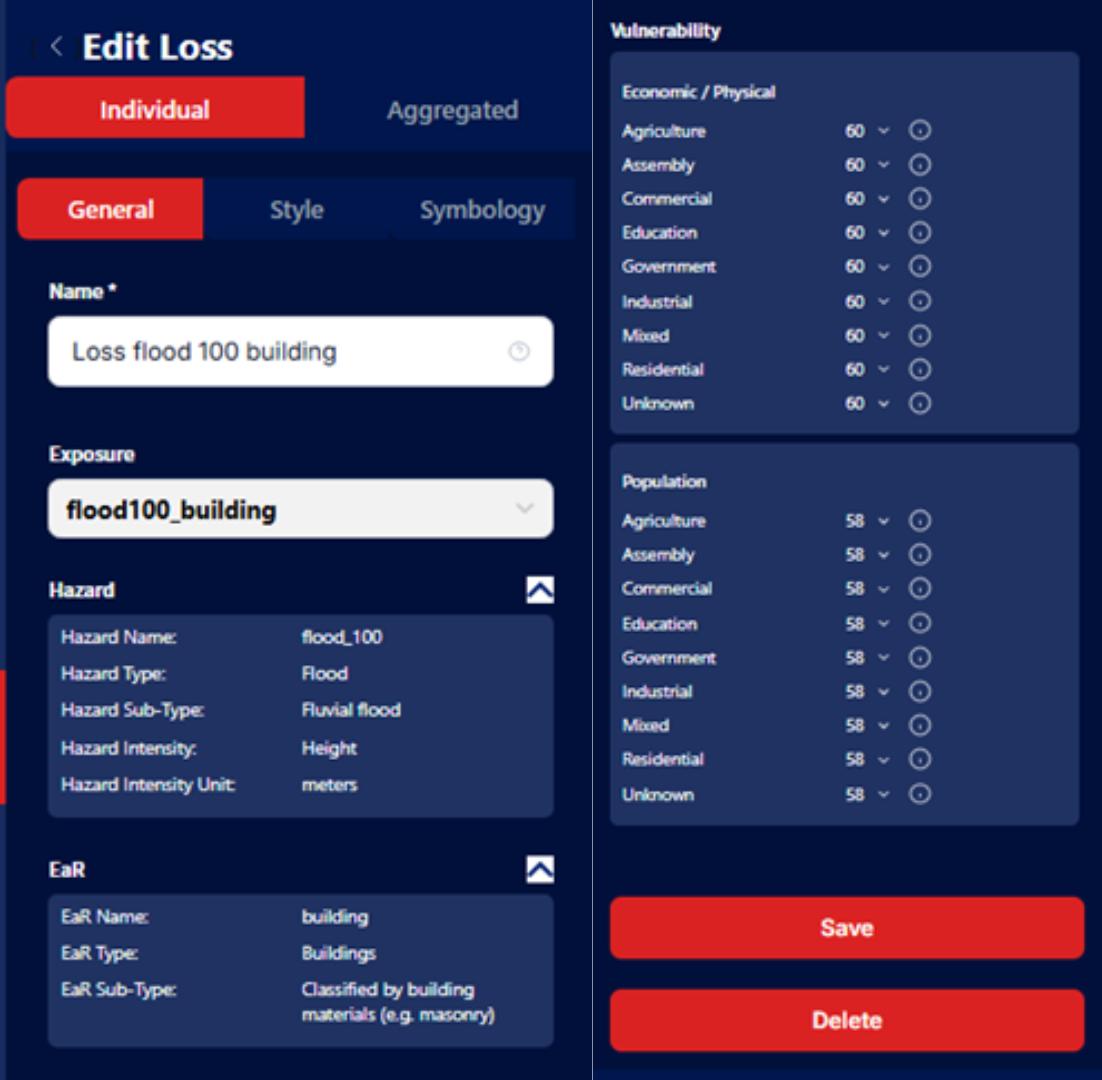
Fill in General Details
Enter a Layer Name.
Select the Exposure Layer you want to use for the loss calculation.
Click Save & Next.
Link to Vulnerability Curves
A table will appear showing the classes of Elements-at-Risk (e.g., building types).
For each class:
Choose an appropriate Vulnerability Curve from the dropdown list.
You can select from All Vulnerability (public records) or My Vulnerability (project-specific).
After assigning all classes, click Save.
View Results
Once calculated:
A Loss Layer will be displayed on the map.
The results table will show extended details, including: - Damage Ratio - Loss Fraction - Loss Area or Length - Loss Number of Floors
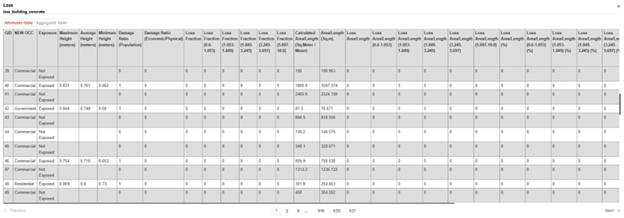
Loss calculation result table
Similarly, results summary and chart are also provided in RiskChanges.
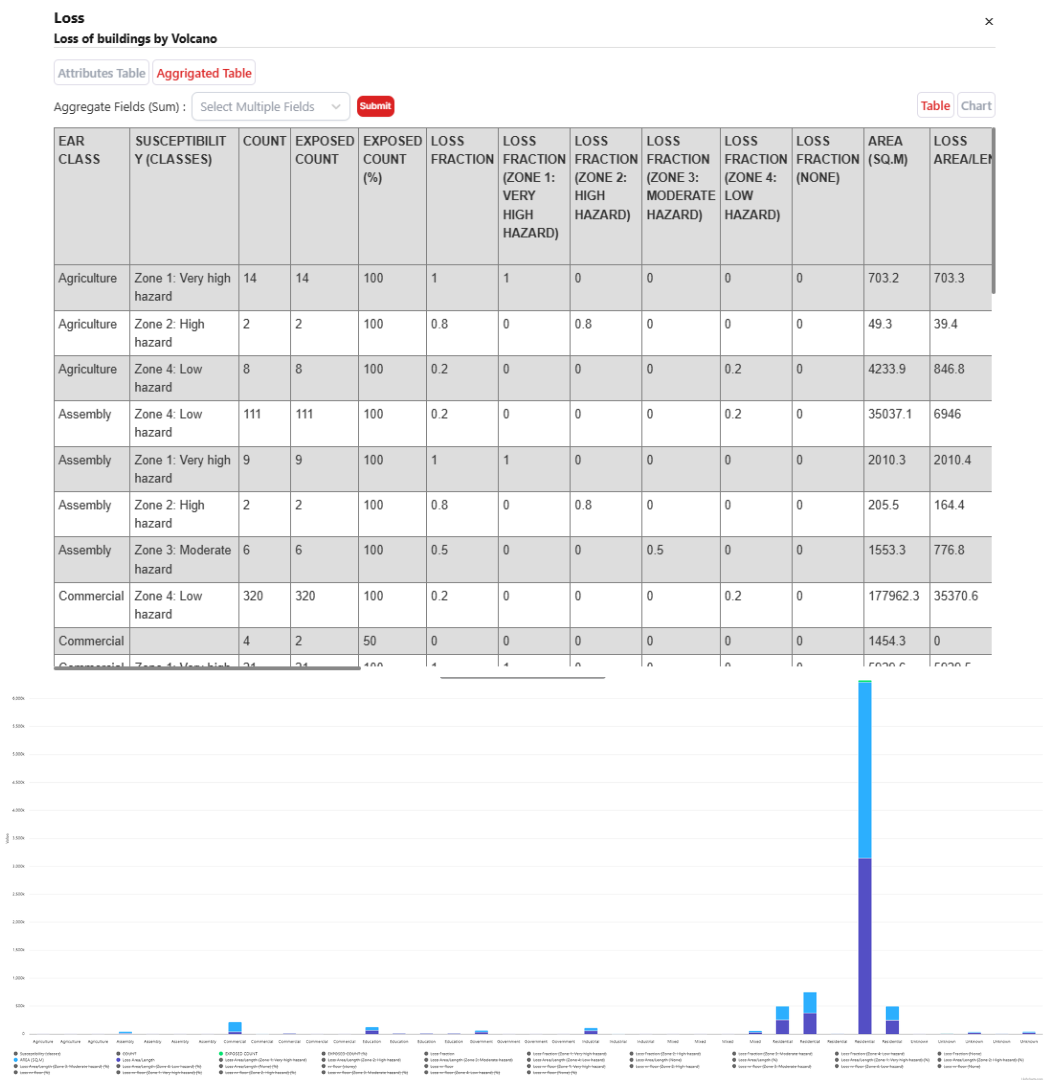
Loss result summary and chart
Adjust Map Visualization
Use the Style section to customize the appearance of the Loss Layer.
Users can set classification methods, color ramps, and labels to enhance interpretation.
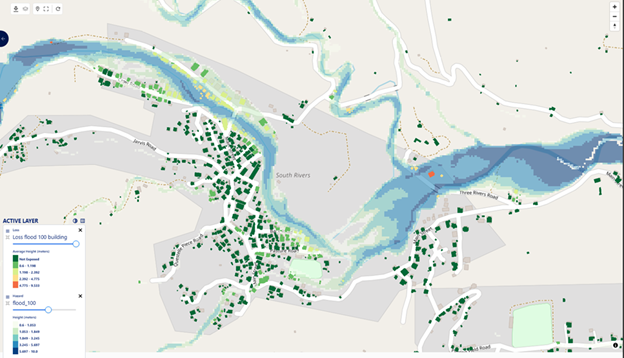
Loss result visualized in a map
Create Scenario
The Scenario Module in RiskChanges allows you to simulate future changes that affect risk levels—such as: - Climate change - Population growth - Land-use changes
Scenarios are used to model how risk evolves over time.
Steps to Create a Scenario:
Open Project Settings - Go to the Project Dashboard. - Select your project and click Settings (gear icon).
Add a New Scenario - Go to the Scenarios tab. - Click Add Scenario.
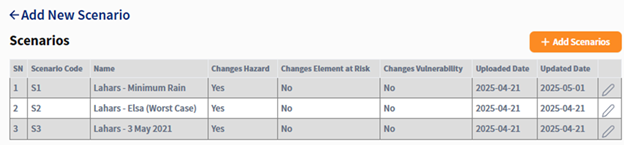
Create a scenario
Fill Scenario Details - Scenario Name: Provide a meaningful name (e.g., “2050 Climate Change”). - Risk Component Affected: Select which component changes (Hazard, EaR, Vulnerability). - Description (optional): Brief explanation of the scenario. - Upload File(s): Attach supporting documents (if any).
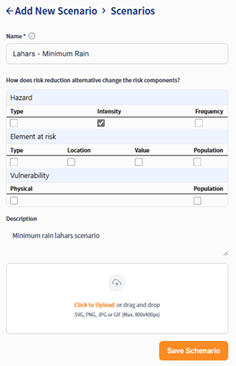
Fill scenario details
Save the Scenario - The scenario will appear in the Scenario Table. - When uploading hazard or EaR layers, you can now assign this scenario to them.
Calculate Loss for Different Scenarios
Once a scenario is created, you can calculate Exposure and Loss under that scenario by uploading the appropriate Hazard or EaR datasets marked with the scenario name.
Repeat the steps from: - Calculate Exposure for exposure calculation - Loss Calculation (this section) for loss calculation
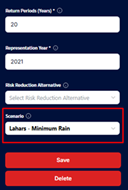
Applying scenario into calculation
Important: When uploading data or calculating exposure/loss under a scenario, make sure to select the correct Scenario Name in the data form. This ensures the results are correctly associated.