Input Data
RiskChanges Dashboard and Modules
RiskChanges consists of several dashboard and modules:
1. User Profile
User profile displays personal information of the user including name and profile photo. Users can edit their details. If the users want to change the password of the account, they can do it from the Change Password option.
2. Project Dashboard
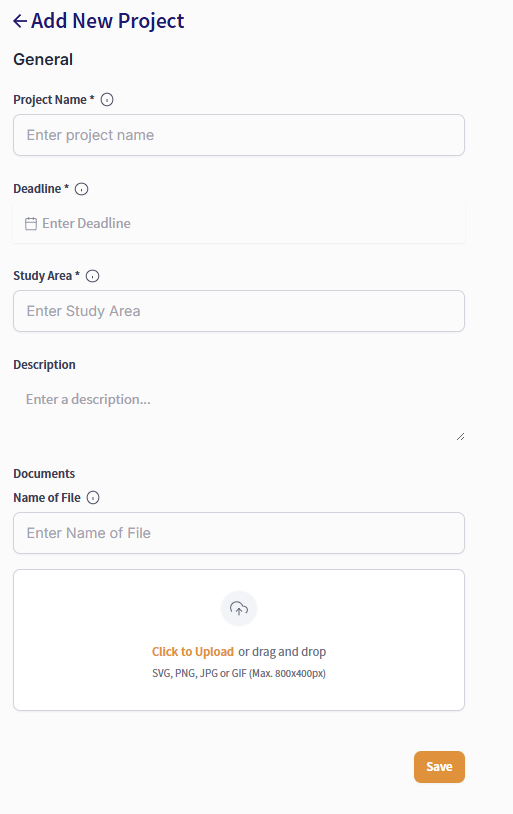
In this dashboard, users can create, manage, and filter project. For creating a project, the users can enter the project name, deadline date, study area, a brief description of a project, as well as uploading documents related to the project. Afterwards, the project coordinator can invite the staff to the project and assign a role for each staff. The staff must approve the invitation that will automatically be sent through email before working on the project. The Alternatives and Scenarios will be defined in this dashboard as well (if any).
3. Project Page
This page is where the users can process data management, exposure, loss, and risk analysis. In this page, the Admin Level, Hazard, Elements-at-Risk, Exposure, Vulnerability, Loss, and Risk modules are available. For each module, the users can define and manage the input datasets as well as the results.
Admin Level: this module is used to upload administrative boundary dataset that later can be used for aggregation in Exposure, Loss, and Risk modules are available. Only shapefile format is accepted in this module.
Hazard: the datasets for hazard can be uploaded in this module. GeoTIFF and Shapefile are compatible for this module. The user needs to define the layer name, hazard type and subtype, hazard intensity type and unit, return period, representation year, and risk reduction alternative or scenarios if applicable.
Elements-at-risk (EaR): the datasets for EaR can be uploaded in this module. GeoTIFF and Shapefile are compatible for this module. The user needs to define the layer name, elements-at-risk type and subtype, representation year, alternative or scenario (if applicable) are required. Global dataset and OGC service will be available soon.
Vulnerability: this module is used to upload or access vulnerabiltiy dataset. For the input, a CSV file is required. Users can also enter the vulnerability values direcctly on the table for the input. The information needed to be defined are vulnerability region and type, hazard type and subtype, hazard intensity mode and unit, EaR type and subtype, EaR class, source, description, and whether the input vulnerability can be shown to the public or not. If Yes is chosen, then all Riskchanges users can also access the entered vulnerability information.
Exposure: calculated for different combinations of elements-at-risk, hazard of different return periods, alternative or scenarios.
Loss: computed as the product of percentage of exposure to hazard, total cost of element-at-risk, its associated vulnerability and spatial probability of the hazards.
Risk: computed based on the calculated losses, for a single hazard or multi-hazard.
4. Visualization
A visualization panel will be displayed on the right side of the page. Everytime new dataset is uploaded, the system will detect the extent and automatically pan-in and show the dataset. The results of Exposure, Loss, and Risk calculation can be visualized in this panel as well, allowing users to display map layers individually or cascades over another and view information according to their needs. Users can also adjust the style and symbology for the visualization.
Register an Account and Setup the Profile
To register an account, go to the landing page and click the  button on the top-right corner of the website. Click
  on the bottom part below the Login form. Fill in the Register form with your name, email address, and password, then click Register.

Register to RiskChanges
Check your email and verify your account. In cas no email comes to your inbox from RiskChanges, check your spam folder. Login to your new account with your email and created password. It will take you to the main dashbard of your RiskChanges Accounts, the Project Dashboard. Make sure your name shows up on the top-right corner, indicating you are already logged in.
Click the name and three options will be shown which are Update profile, Change Password, and Logout. By clicking each of those, you can update your profile, change your password, and logout.

Update your RiskChanges profile
Create a Project
The Project Dashboard consists of the list of projects that the users have created or have been assigned to. Aside from that, in this dashboard users can also flter and search a specific project by name, study type, hazard type, or sorting the project.
To create a project, click  to be redirected to the Add New Project page. There are four pages to be filled related to the project, which are
  ,
,  ,
,  , and
, and  . Ony the page is compulsory to be filled in order to create a project. In the page, users need to enter related details about the project. The page allows users to invite and assign the team members in the associated project.
Create a New Project
The project that are created or assigned to the user are displayed as cards in the Project Dashboard and can be filtered easily through the filter functions.

Project Dashboard
Upload Administrative Boundary
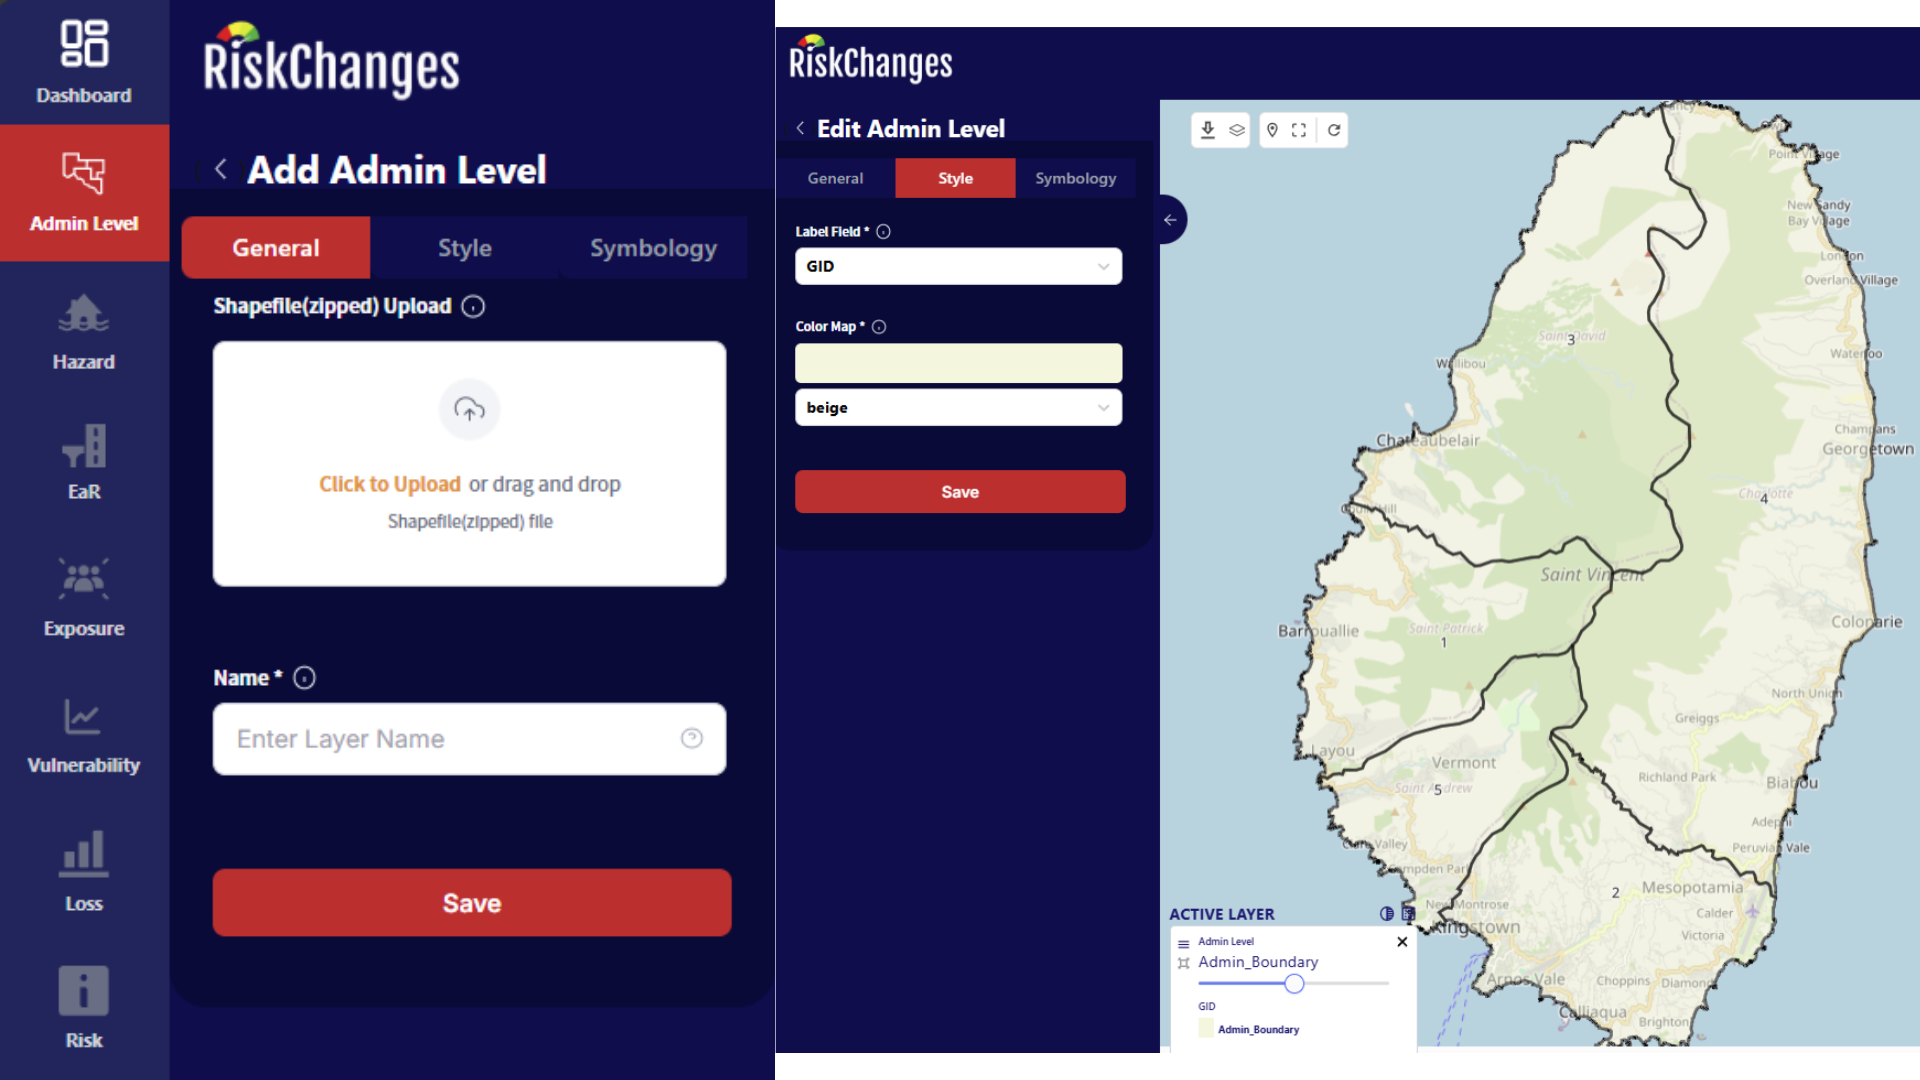
From Project Dashboard, choose the project you will work on and click on the project name. Choose Admin Level and click Add Admin Level. In the General section, upload your administrative shapefile (in a zipped file).
Click to Upload or drag and drop the admin units data to upload the data.
Type in Name and click Save.
The administrative boundary will be automatically loaded in the map canvas with a single symbol styling.
Users can change the visualization style and symbology of the map view.
Upload Administrative Boundary File
Upload Hazard Data
Go to Hazard and click Add Hazard. In the General section, upload your hazard data. The data must be in either a GeoTIFF or shapefile (in a zipped file) format. Other options are soon to be available which are to connect to OGC Service or Global Dataset.
Click to Upload or drag and drop the hazard data to upload the data.
Type in Layer Name, Hazard Type, Hazard Subtype, Hazard Intensity Type, Hazard Intensity Unit, Return Period (years), Representation Year, Risk Reduction Alternative (if applicable), and Scenario (if applicable).
Click Save and the hazard layer will be automatically displayed in the map canvas.
The default styling is a Single Symbol for raster data. Whereas for vector (shapefile) dataset, if the hazard intensity type is Susceptibility, the default style is Categorized.

Upload Hazard Data
The Style section is used to adjust the settings for the layer’s visualizatino. Additionally, the chosen style will also be applied as the base classes for Exposure assessment. Users can also go to the Symbology section to adjust the layer’s labels.
Select the Style Mode whether it is Single Symbol, Graduated, or Categorized.
For Single Symbol, users need to select the dataset’s Field which will be used as well as the Minimum Value to be displayed. Then. a Color Map will be selected for the visualization.
For Graduated, after selecting the dataset’s Field, Minimum Value, and Maximum Value, Total Class needs to be defined as well as the Classification Method (optionis available are equal interval, quantile, natural breaks, standard equation, geometric interval, logarithmic scale, and percentile). A Color Map needs to be selected as well for visualization.
Click Save.

Hazard Symbology Settings
Upload Elements-at-Risk (EaR) Data
Go to EaR and click Add EaR. In the General section, upload your EaR data. The data must be in either a GeoTIFF or shapefile (in a zipped file) format. Other options are soon to be available which are to connect to OGC Service or Global Dataset.
Click to Upload or drag and drop the EaR data to upload the data.
Type in the Layer Name, Element-at-Risk type, Element-at-Risk subtype, Representation Year, Risk Reduction Alternative (if appicable), and Scenario (if applicable).
Click Save and the uploaded EaR layer will be automatically displayed in the map canvas. The default styling is single symbol.

Upload Elements-at-Risk Data
The Style section is used to adjust the setting for the layer’s visualization. Additionally, the chosen style will also be applied as the base classes for Exposure assessment. There are three options for the Style Mode, which are Single Symbol, Graduated, or Categorized. Users can also go to the Symbology section to adjust the layer’s labels.
For Shapefile dataset:
For Single Symbol, users need to select the Color Map for the visualization. An additional option to Enable Stroke is also available.
For Categorized and Graduated, users select the dataset’s Field to be used for visualization. The fields are Area Field, Area Field Unit, Value Field, Value Field Unit, Population Field, Population Field Unit, and Other Field as well as Other Field Unit. These fields are important and need to be selected in order to calculate the Loss.
A Color Map needs to be selected as well for visualization. An additional option to Enable Stroke is also available.
For Raster dataset:
For Single Symbol, users need to select he dataset’s Field which will be used as well as the Minimum Valule and Maximum Value to be displayed. Then, a Color Map will be selected for the visualization.
For Graduated, after selecting the dataset’s Field, Minimum Value, and Maximum Value, Total Class needs to be defined as well as the Classification Method (options available are equal interval, quantile, natural breaks, standard deviation, geometric interval, logarithmic scale, and percentile).
A Color Map needs to be selected as well for visualization.

Elements-at-Risk Symbology Settings
Please note that the Vulnerability data is necessary for Loss and Risk calculation. The Exposure calculation does not require Vulnerability input. Therefore, if users only need to do Exposure assessment, entering Vulnerability data is not compulsory.
Upload Vulnerability Data
Go to Vulnerability and click Add Vulnerability.
Users can upload a CSV file under the General section to add a record automatically or input the values directly under the Data section. The uploaded CSV file needs to have information of Hazard Intensity From, Hazard Intensity To, and Vulnerability Data. After uploading, this information will be stored under the Data section as well.
Before uploading the record, users need to fill out some details regarding the data which are the Vulnerability Region, Vulnerability Type, Hazard Type, Hazard Subtype, Hazard Intensity Mode, Hazard Intensity, Hazard Intensity Unit, EaR Type, EaR Subtype, EaR Class, Source, Description, and Is Public. The Is Public column defines whether the Vulnerability record will be available to all users of RiskChanges or whether it will be kept under the user’s personal project.

Upload Vulnerability Table
Notice that there are two categories of My Vulnerability and All Vulnerability. If users chose Yes as a public vulnerability, the record will be stored under All Vulnerability. On the other hand, the record will be stored in My Vulnerability if the users chose No as a public vulnerability.
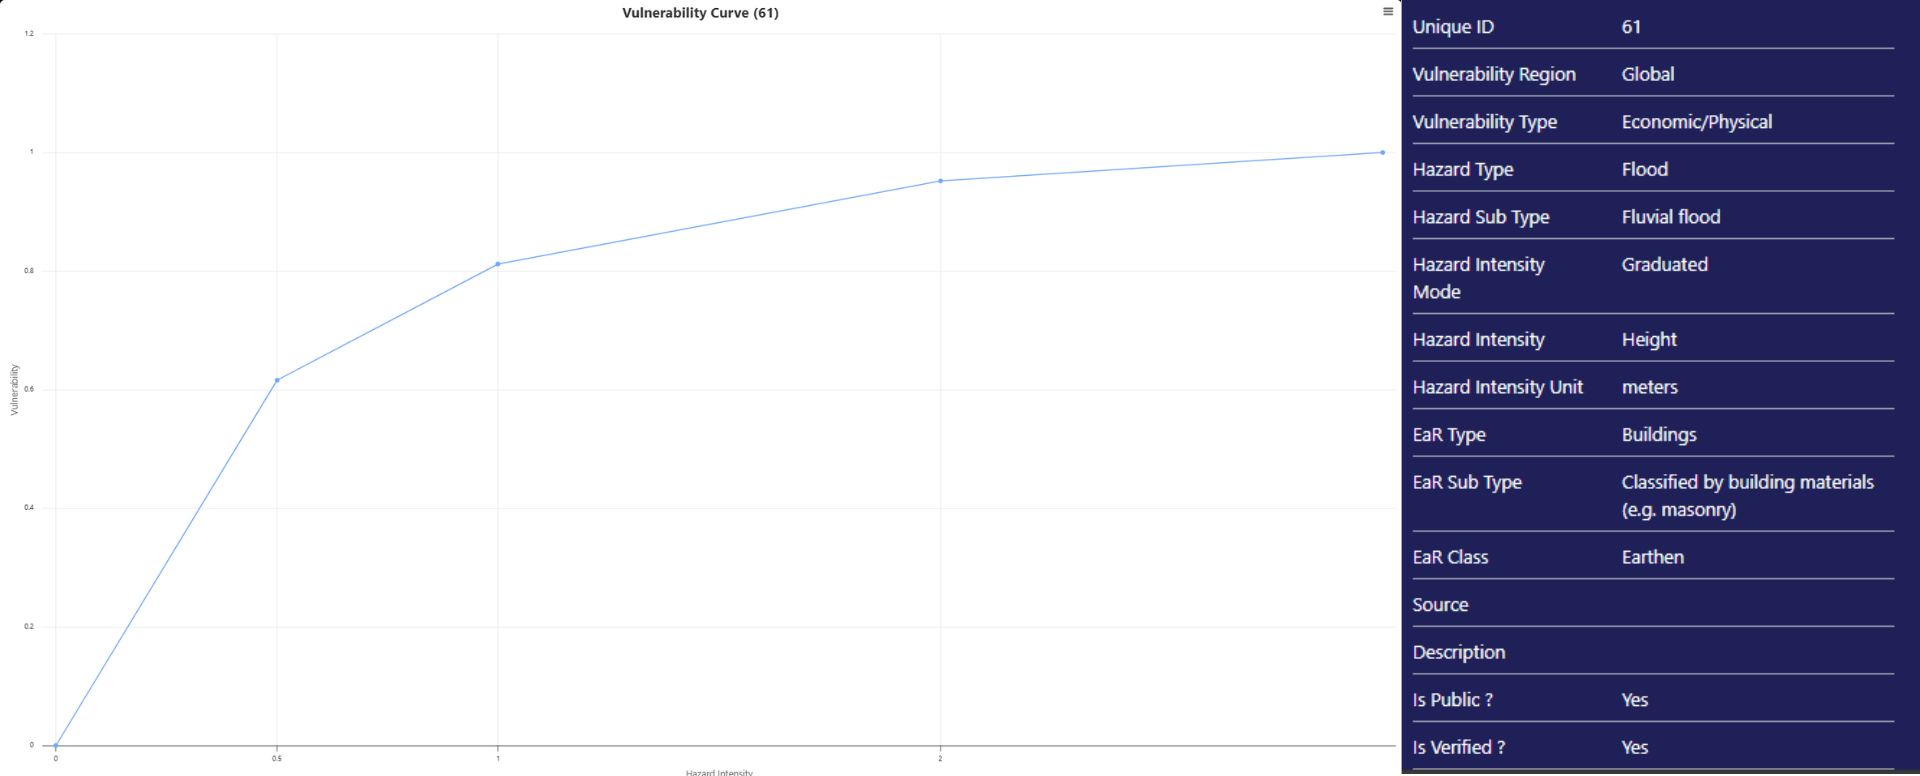
Vulnerability Table Data
Please note that the visualization of hazard, Elements-at-Risk, and Exposure will affect the calculation of the next steps. For example, the classes or value ranges chosen for Hazard and Elements-at-Risk will be applied to calculate exposure. The same combination which results in the Exposure calculation will then be applied to calculate Loss.
If users would like to calculate a different class or range value, they need to re-calculate the Exposure with the updated class or range value selection before calculating the Loss.